Unlike analysis and simulation, reporting and evidence is focussed on the application of analytics and modeling to support or question some proposed ation. The presentation of the analytics and modeling as evidence, requires communicating analytical results to a wider audience, who will typically be less fluent in the vocabulary of the workplace analytics.
If 42 is the answer, what is the question?
The ultimate question Arthur Dent and Ford Prefect attempt to discover in the Hitchhiker’s Guide To The Galaxy
Whilst reporting and evidence does require a proposed action, care must be taken to ensure that the analytical approach taken to evidence such an action is fair. It is sometimes tempting to look for evidence that supports the proposal, rather than taking a balanced view. An analyst must look for evidence to both prove and disprove the theory that the proposed action will indeed yield the anticipated outcomes, and – if necessary – seek additional data to make suitable analysis possible.
As has been shown throughout the Anatomy of Occupancy Analytics, there are very great opportunities for errors to be overlooked, data to be misinterpreted, and analyses to be misconstrued. Robust selection of the analytical methods to use for determine the viability of a particular proposal is therefore key.
Selection of analyses
The first step in analysis selection is to understand clearly what the proposed action or actions are. This is often not straightforward, as demands for a “utilization analysis” or “occupancy profile” can often be received by an analyst with little or no context.
Whilst the analyst can perform such analysis, the critical step of interpreting the results – which of the entire process is the step that requires the most specialist input from the analyst – is often left to other, less skilled colleagues. These colleagues lack the foundations laid out in the Anatomy, and without the discipline to ensure the four key steps of measure, correct, analyse and evidence are carried out adequately, their interpretation of the complex analyses are often flawed.
As a general rule, analytical outputs should not be shared with non-analysts. The analysts role is to use the analytical tools at their disposal to select and exploit the relevant analyses for a given context, and then present that analyses as evidence (which is covered below in ‘communicating evidence’).
The analyst can use the following questions to support the solicitation of the context and implied action(s):
- why is this analysis required?
- what change is being contemplated?
- what is evidence being sought to support?
- is there more than one possible outcome of the decision making process?
- how important is this decisions?
- who needs to be involved if the analysis doesn’t support the proposal?
- what is the cost of getting this decision wrong?
- what is the opportunity if we get the decision right?
These questions may just be a starting point in understanding the context. They may highlight red-flags – for example of the answer to question 4 is “no”, then this may just be a box-checking exercise to evidence a decision that has already been taken.
The contexts can be very varied indeed. Some more common examples are listed below, but there are hundreds of scenarios that can and should be supported by appropriate analysis:
- Relocation at the end of a lease driving the need to establish the space requirements for the new location before going to market
- Evaluating the viability of moving the occupants of one building into another in order to close down one of the buildings and save money
- Estimating the actual demand for adjacent co-working space if the existing leased space is reduced by 25%, 50% or 75%
- Determining whether growth in a particular team is going to have an adverse effect on the productivity of either that team or other building users, and at what thresholds the various impacts are likely to surface
- Establishing the space requirements if two teams who currently collaborate extensively are collocated and comingled in the same floor neighbourhood
- The impact on energy consumption, CO2 emissions and time-between-moves of reducing structural vacancy from 20% to 10%
- Considering the viability of a further 20% space reduction to manage costs in a location that has already taken the step of moving to unassigned desks that would increase the Density from 1.1 people per desk to 1.38 people per desk.
Although each of these shares common basic questions about behaviour in and around office buildings, each will also require its own unique analyses, based on distinct proxy hypotheses, and the detection and correction of errors will vary accordingly.
Communicating evidence
Once analyses has been conducted, the communication of the outcomes is critical. As with all communication, the audience must be understood, and the language and style suited to their context and perspective.
It is good practice to begin any communication or report by stating some facts that level-set the consumers and help build confidence by confirming that the analysts and audience are working on the same question. The following may be interesting facts to present:
- Building geometry – number of floors, location/address, usable area, number of workstations, offices, meeting rooms, collaboration spaces, community spaces etc.
- Lease summary – landlord, current rent, rentable area and any subleases
- Organizational units – which are using the building, their relative sizes and any significant information about the floors or zones within the building each occupies
It is sometimes helpful to also provide some upfront information that indicates that the analysis that has been conducted is less than straight-forward. This is particularly useful in cases where the audience has a history or a tendency of over-simplifying workspace capacity planning, or where the audience is broad – perhaps all organizational unit leaders – and the sponsor of the proposed action is struggling to gain alignment.
A balance must always be drawn between educating the audience about the robustness of the analytical methods, and maintaining simplicity in the presentation of the findings. One method that can help achieve this is to provide a simply “occupancy statistics” table early on in the report that is easily understood but at the same time signals the subtlety and complexity required to interpret what is happening. Such a table is shown below:
| OCCUPANCY STATISTICS | ||
| Population | The total number of people (identities) seen during the analysis period by any of the proxies – access control system, reservation management system, and network connections. | 612 |
| Analyzed | The number of people included in the analysis once non-consumers had been identified and removed (facility operations like cleaning staff, visitors etc.) | 537 |
| Assigned | The number of people assigned to this building according to the HR system. | 365 |
| Peak | The maximum number of people seen on any one day during the analysis period. These people were not necessarily all in the building at the same time. | 277 |
| Mean | The average (mean) number of people seen each day during the analysis period. | 227 |
| Median | The average (median) number of people seen each day during the analysis period, i.e. occupancy in the middle of the frequency distribution, and for which there is an equal likelihood of the occupancy on any day falling above or below. | 219 |
| 75th percentile | The level below which the occupancy on 75% of the days in the analysis period fell. Conversely, the occupancy exceeded this level on only 25% of the days. | 243 |
| 90th percentile | The level below which the occupancy on 90% of the days in the analysis period fell. Conversely, the occupancy exceeded this level on only 10% of the days. | 256 |
Before presenting the specific evidence or outcomes, the context should be restated (based on the questions above used to determine the analyses employed) and the scenarios under consideration outline. This sets the scope of the analyses and helps to ensure that the analysis provided is only used for the purpose for which it was designed, and not repurposed to support some other proposal for which it may not be suitable.
The summary below shows three options for shrinking an existing office alongside the existing position. The implications or considerations of the three options presented are briefly summarized next to each, and these are set alongside the contextual occupancy data already referenced above.
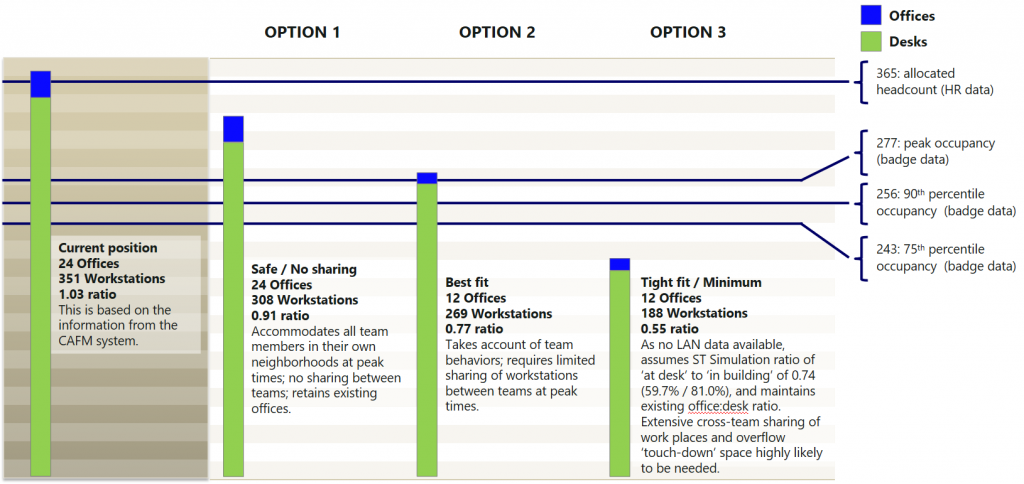
Such a summary can provide a useful talking point with stakeholders, and give them an opportunity to ask questions and explore the relationship between the provision of space and the demand or occupancy. For many stakeholders, this will be the first time they have had a substantive conversation about such an analysis.
It will also be necessary to provide similar summaries for each stakeholder group within your audience. For example, it may be necessary to provide a summary (similar to the above or perhaps in a more tabular or narrative format) for each team leader/manager, so that they can see what this would mean specifically for them and their people.
Presentation of shared resources – for example meeting rooms, cafeteria, collaboration space etc. – must also be considered. The stakeholders’ perspectives must be carefully considered and the evidence curated accordingly. For example, when reporting on meeting room use, care should be taken to understand which teams are driving the meeting room demand to establish whether there may be different perceptions across the various teams or individuals.
It is also important to ensure the communication contains appropriate cautions for any data for which there are unproven proxy hypotheses, or uncorrectable errors. Such statements must be in as plain language as possible. For example, the following is an extract from a report describing meeting room use:
Conference room reservation data has no correlating measure, and therefore its accuracy is difficult to estimate. However, given the relative abundance of meeting space, it is likely that people will not feel
Extract from a report on meeting room use cautioning the audience
the need to make reservations, and so actual use is likely higher than reported use, but not so high as to drive users to feel the need to make reservations.
Predictive and prescriptive analytics
Whilst many organizations are focussing on decision support analytics described above, an increasing number are beginning to look at the viability of moving beyond analytics that support specific decisions and instead building continuous analytical processes.
These processes can be assembled of standard analytics that are tuned to identify a particularly important trends. For example, basic building occupancy analytics could be undertaken systematically (for example daily, weekly or monthly automated analyses). These analyses could then be used to identify increasing or decreasing trends which could be then used to trigger a review of, say, cafeteria staffing, cleaning services, or meeting space provision.
PREDICTIVE ANALYTICS
The use of systematized analyses or simulations to continuously anticipate future demand and trigger a review of provision when the forecast demand exceed predetermined thresholds.
Going beyond this, it is possible to consider the automation of the review of provision and use the analyses to directly and automatically adjust supply in some cases, or at least self-determine the required action and initiate the action.
PRESCRIPTIVE ANALYTICS
The automation of action execution or action initiative based on the outputs of Predictive Analytics.
For example, Predictive Analytics may identify that there is a decreasing trend in a particular building’s use. Prescriptive analytics would take this prediction and – for example – use it to automate a change order to the cleaning contractor to reduce the frequency of restroom cleaning.
It can be argued that Prescriptive Analytics is no more than simple automation – albeit based on more sophisticated triggers. This speaks to the ever growing maturity and expertise in exploiting the value in data, and challenges the status quo with the question: when our current prescriptive analytics are considered simple automation, what will the new prescriptive analytics be?