As illustrated in the diagram below, in this example there are 10 meeting rooms, A to J (the Spaces).
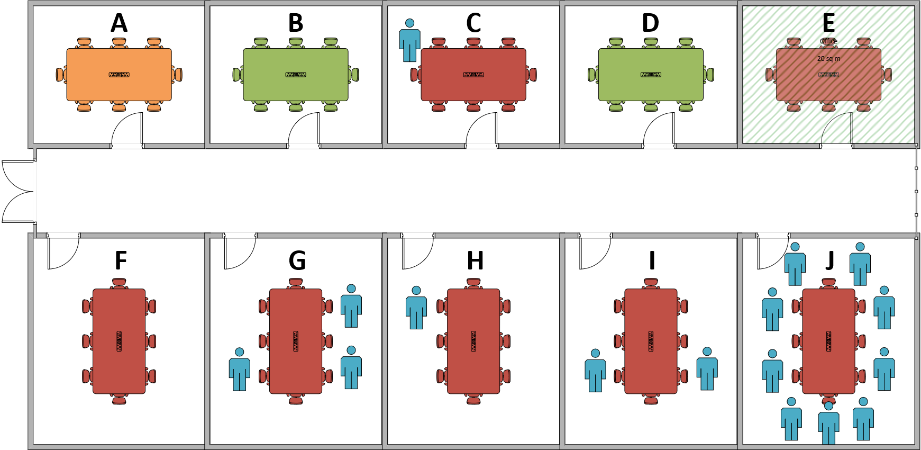
Each room has a Capacity of 8 people, 5 of which (A – E) have an Area of 20sqm and 5 (F – J) an Area of 30sqm.
At 10:34 on March 12th, 2018 the following Occupancy was established(1):
- Room A: Not reserved, and no one present, but papers, two laptops and drinks one the table;
- Room B: Not reserved and empty;
- Room C: Reserved and one person present;
- Room D: Not reserved and empty;
- Room E: Currently assigned permanently to a project team, with flip-chart paper covering the walls, but no one present;
- Room F: Reserved but no one present;
- Room G: Reserved and in use by three people;
- Room H: Reserved and in use by one person;
- Room I: Reserved and in use by two people; and
- Room J: Reserved and in use by nine people (eight seated and one standing at the whiteboard).
In this scenario, at 10:34 on March 12th 2018:
- The Assigned Utilization of Area at this time was 8%, because only room E was assigned (to the project team) and its area of 20sqm is 8% of the total meeting room area of 250sqm;
- The Physical Utilization of Capacity at this time was 20%, because 16 people were present, the Capacity is 10 rooms x 8 seats = 80 people, and 16 / 80 = 0.2 (20%);
- The Physical Utilization of Resource Count at this time was 50%, because 5 of the 10 rooms had people in them;
- The Apparent Utilization of Resource Count at this time was 70%, because 7 of the 10 rooms had people in them or “physical adjustments indicating use” (room A had papers, laptops and drinks and room E had flipchart paper covering the walls);
- The Implied Utilization of Resource Count at this time was 80%, because 8 of the 10 rooms (all except B and D) had either people in them, an assignment, a reservation, or physical belongings indicating use; and
- The Implied Utilization of Area at this time was 84%, because all the rooms except B and D have Implied Occupancy, their area total 3 x 20sqm + 5 x30sqm = 210sqm, out of a possible 250sqm, and 210 / 250 = 0.84 (84%).
It may seem at first that the above definitions and the consequential variety in types of Utilization adds unnecessary complexity – would it not be better to pick just one definition? The reality is that all these types of Utilization are important as they provide different insights, and even in this simple example the range of Utilization (from 8% to 84%) shows how important it is to pick the right one.
In the example, these different types of Utilization provide different insights:
- The 70% Apparent Utilization of Resource Count tells us that 30% of the meeting rooms appeared empty – rooms B, D and F. Anyone searching for an available meeting room at this time may well have elected to ‘squat’ (i.e. use without a reservation) any of these three apparently unutilized rooms. If this Apparent Utilization was a peak value measured over a significant period, this might suggest that there are more meeting rooms that are needed, and some of the space dedicated to these meeting rooms could be reclaimed and repurposed.
- The 20% Physical Utilization of Capacity suggests a significant surplus. Again, if this were a peak over some significant period, and in combination with the 70% Utilization of meeting rooms, this may indicate that the meeting rooms provided are not of an appropriate capacity, in other words it may be beneficial to split some of these 8-person meeting rooms in to pairs of 4-person meeting rooms. If this were done for 5 of the 10 meeting rooms (to create a total of 15 meeting rooms, 5 with capacity of 8 people and 10 with capacity of 4 people), then the Utilization of the meeting room capacity would remain at 20%, but the Utilization of meeting rooms would drop from 70% to 47% (7 in use out of 15 instead of 7 out of 10). This in turn might suggest reclaiming some of the meeting room space and repurposing it, but with far greater effectiveness than that accessible using the spaces Utilization measure alone.
- Similarly, the 84% Utilization of the area for meeting rooms provides yet another perspective. In combination with the other data, this indicates usage behaviour that is inefficient – not only choosing 8-person rooms for single use and 2- or 3-person meetings, but also often choosing the larger 8-person rooms over the smaller 8 person rooms in these cases. This behaviour could be driven by many factors – including the reservation system, local knowledge, or personal preferences – but understanding its presence allows managers to consider whether changing these behaviours would be beneficial, and – if so – some evidence that could be incorporated into communications designed to achieve the desired behaviours.
- Note that none of these aggregated Utilization measures highlight the nine people using the 8-person room J nor explicitly the single use of rooms C and H. Identifying these cases requires specific analytics that filter specific occupancy episodes (low occupancy; high occupancy) or that identify statistical outliers. More on these techniques later.
FOOTNOTES:
- See Measurement for methods of establishing Occupancy