The University of the North reluctantly decided that it had to imitate its rivals and open a London satellite campus (UNLS). A search for suitable premises led to a lease on four floors of Mistral House, a commercial building of the 1970s in a central but affordable location.
The University appointed a design and build consortium to deliver the satellite campus at Mistral House, stripping out the four floors and installing a new layout to meet the University’s requirements. An important requirement was lecture room provision.
This came up at a meeting when Tony Brisk, the Project Manager for the design and build consortium, told Greg Burns, the University’s Head of Estates, that they urgently needed to know what lecture rooms should be provided. A study by the Space Management team would delay the decision, so Tony and Greg agreed that it would be a good idea to have sixteen lecture rooms, four of them large (120 seats), six medium (60 seats) and six small (30 seats). They thought this would be a neutral schedule, not making any assumptions about the relative number of large, medium and small lectures.
Tony Brisk passed this lecture room schedule to Douglas Evans, a partner in the architectural practice that had been recruited by the design and build consortium (on a fee bid) to prepare drawings. He in turn passed it to Bob Thomas, a young architect in the design team for the Mistral House fit-out.
Bob Thomas tried some sketch layouts and quickly discovered that the four large lecture rooms took up a surprisingly large proportion of the floor of Mistral House that had been assigned to lecture rooms. He wondered whether it was a good use of space. He raised this query with Douglas Evans, who went back to Tony Brisk and suggested a study of alternative lecture room sizes. Tony said the programme was tight and they should get on with the drawings.
This non-response was relayed to Bob Thomas, but being young and enthusiastic he was more interested in the design question than the Project Manager’s programme. He had already been in touch with staff in the University’s Estates Department to collect briefing data, and he went back to them to ask about the lectures that were expected at UNLS. He was put in touch with Jane Kucynski, a key figure in the Space Management team who interfaced with the University timetablers. She worked out the annual changes to lecture rooms in response to the University’s evolving timetable. Jane was slightly miffed that this was the first she had heard about the schedule of lecture rooms for UNLS, and was motivated to show off her expertise. She agreed to look into Bob’s question and meet in a week’s time.
Jane quickly discovered what courses would be offered at UNLS, and she extracted data for equivalent courses from the current University timetable, giving a best-guess profile for the number and size of lectures that could be expected at UNLS. It showed that 343 lectures could be expected in an average week, and 470 lectures in the busiest week. The lecture sizes (number of students attending) varied from over 100 to 10 or less, with the most commonly occurring being around 30-40. This was not an exact prediction of the number and size of lectures, which would anyway change over time, but Jane was confident that it captured the key features of the demand profile and provided a starting point for analysis.
With an estimate of the lecture demand, Jane’s attention turned to the supply of lecture rooms. The demand for lectures and the supply of lecture rooms are linked by the timetable. To create a timetable for a teaching week with 40 time periods, the week’s lectures are subdivided into 40 bundles for the different time-periods, and then each bundle’s lectures are assigned to lecture rooms. There is a vast number of possible ways of subdividing the lectures into bundles and assigning them to rooms, but many turn out to be impractical because they violate ‘hard’ constraints (for example: no-one can be in two places at the same time; there cannot be more lectures in a bundle than there are lecture rooms; lectures must be allocated to rooms that are large enough), as well as ‘soft’ constraints (for example: Professor A prefers not to teach on Fridays). The tighter the constraints, the harder the timetabling task; thus, more and larger lecture rooms are better for timetabling, even though they may be inefficient in terms of spatial provision.
Jane wasn’t trying to create a timetable for UNLS but she was interested in the constraints imposed by the lecture room schedule. She figured out that this could be explored through a simulation exercise using the best-guess data for the number and size of lectures in a teaching week. She could randomly simulate many bundles of lectures, and compared them with a lecture room schedule to check how many could be accommodated (ie. bundles for which there are enough rooms of sufficient size for every lecture). It is not necessary for every one of the simulated bundles to be accommodated, but the higher the proportion the better for timetabling.
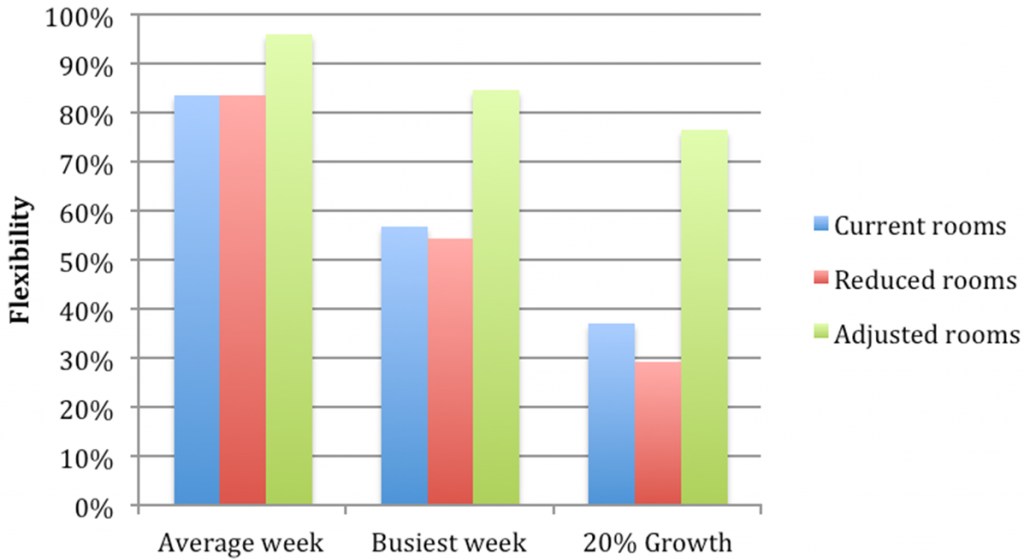
When Jane met Bob she showed him the best-guess data about the UNLS lectures and explained her method for evaluating lecture room schedules. She asked what lecture room schedules he would like her to test. Back in his office Bob compared the best-guess size profile of lectures and the size profile of the sixteen lecture rooms in the client’s current schedule. It was evident that there was an excess of large lecture rooms inefficient provisions for small lectures. Bob e-mailed two alternative schedules to Jane to compare with the client’s schedule: the first ‘Reduced’ schedule had three fewer rooms and 23% fewer seats than the client’s, and the second ‘Adjusted’ schedule had two more rooms but the same number of seats.


Jane e-mailed back to confirm that she would test the performance of these three lecture room schedules for an average teaching week, for the busiest teaching week, and for a growth scenario with 20% more lectures than the busiest week.
A week later Bob and Jane met again. The results of Jane’s analysis showed that the Current and Reduced schedules of lecture rooms performed equally for the average teaching week (84% success rate), and almost equally for the busiest week (57% Current, 54% Reduced), with a slightly wider gap for 20% Growth (37% Current, 29% Reduced). Bob could see a strong case to making a 23% saving in lecture rooms capacity in exchange for a much smaller drop in performance, but the poor showing of both schedules for 20% Growth was worrying. Then Jane showed him the far superior results for the Adjusted schedule: 96% success for the average teaching week, 85% success for the busiest week, and 76% success for 20% Growth. Bob was elated. The results confirmed his intuition that the client’s lecture room schedule was a feeble effort and should be revisited.

Next day Bob reported the results to Douglas Evans with great excitement. He said it was obvious that the client’s lecture room schedule should be scrapped, and that he and Jane should do more studies to establish the optimum schedule, taking account of cost and future flexibility. Douglas was convinced by the argument, but dreaded the meeting with Tony Brisk.